
Using Light to Trace Dark Matter
Studying the spatial distribution of extragalactic source populations is vital in understanding the matter distribution in the Universe, the cosmological evolution of matter density fields and the relationship between dark matter and luminous matter. This article investigates the clustering properties of radio-selected sources in the Lockman Hole field at 325 MHz using legacy GMRT data. Based on their radio luminosity, the radio sources are classified into Active Galactic Nuclei (AGNs) and Star-Forming Galaxies (SFGs). The relevant parameters are determined for both the combined populations and individual classes. The spatial correlation length and the bias of AGNs are greater than SFGs- indicating that more massive haloes host the former. This study is the first reported estimate of the clustering property of sources at 325 MHz, intermediate between the pre-existing studies at high and low-frequency bands.
Matter that we are familiar with- “normal” matter- constitutes only about 5% of all matter in the Universe. The rest is about 27% “dark” matter - the type of matter that does not interact with light, and hints at its existence only via its gravitation, with the remaining 68% being the elusive dark energy driving the expansion of the Universe. Galaxies are formed in dark matter haloes- huge pits of dark matter that gravitate i.e. pull normal matter inside it, and then through a series of complicated physics, form galaxies. Thus, we can understand properties of dark matter using light from galaxies. This has been done successfully by large galaxy surveys like the Sloan Digital Sky Survey (SDSS). As seen in Figure 1, these surveys create a map of the Universe using galaxies which are located at very large distances away from us. Light travels at a finite speed, so light from large distances effectively means mapping light coming from further back in time.
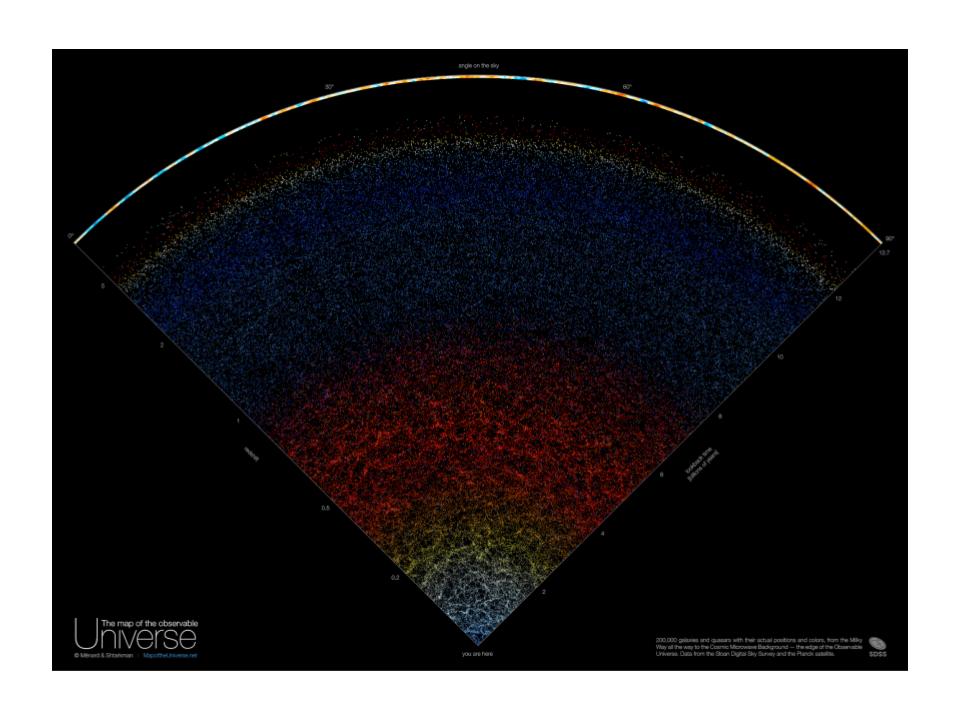
Figure 1: Distribution of galaxies in a wedge-shaped section of the Universe as seen by the Sloan Digital Sky Survey. (Image credits)
In cosmology (which is the study of large scale properties of the universe as a whole1), one of the most important things we study is the large-scale distribution of baryonic matter (i.e. matter that emits light) and dark matter in the Universe. In Cosmology, like any study involving large-scale distributions, we use statistics. Since the Universe has billions of galaxies, and we know how to detect them with telescopes, they can be used as good statistical samples. We can use them to study the two-point correlation function, i.e., given a random galaxy, how probable is it that we see another one within a given distance? This correlation function (and the distance, called correlation length) gives us the big picture of the large-scale distribution of matter.
Large cosmological simulations show that dark matter haloes have a tendency to cluster together. In observations, this is translated to “galaxies are clustered”. If our survey has a large enough number of galaxies, we can use them to calculate this clustering behavior and indirectly trace the underlying dark matter distribution. However, we need to be careful with our interpretation when using galaxies since they only form in regions where dark matter haloes meet certain threshold density. Thus, galaxies are “biased” tracers - that is to say they do not give the complete distribution, but a skewed version of it. However, using theoretical estimates, we can calculate the amount by which our results are biased and thus, in principle, trace back the true distribution. Galaxies also evolve over time- they undergo mergers and other interactions, which are dictated by their local motion as well as the expansion of the Universe. Thus, if we are able to determine the evolution of bias parameters as a function of time, we have a way to trace time evolution of galaxy properties, and hence those of the underlying dark matter.
In this work3, we used data from GMRT2 that covered a sizable area of the sky to create a statistically relevant sample for measurement of the bias parameter. Such studies are well developed for optical surveys, but using radio data for these observations took off much later, with the advent of large radio surveys like the NVSS and FIRST in the 1990s.
We divide the full sample of our radio-detected galaxies into two sub-samples: Active Galactic Nuclei or AGNs and Star-Forming Galaxies or SFGs (SFGS are dominant types of galaxies present in data from radio telescopes like the GMRT). Not all galaxies are made the same- they have different masses, have different star formation rates and efficiencies, cycle matter differently, and reside in dark matter haloes of different sizes. Both these types of galaxies are well studied in terms of their individual properties, and using these properties, their host dark matter halo masses are inferred using simulations. Each of our sample galaxies comes with a redshift 4 (i.e the time when the light actually left the galaxy) associated with them- meaning we know reasonably well how far back in time the light we observe comes from. We create a distribution of these redshifts and pick the median value for our calculations. In Figure 2, we plot our calculated bias parameters function of redshift.
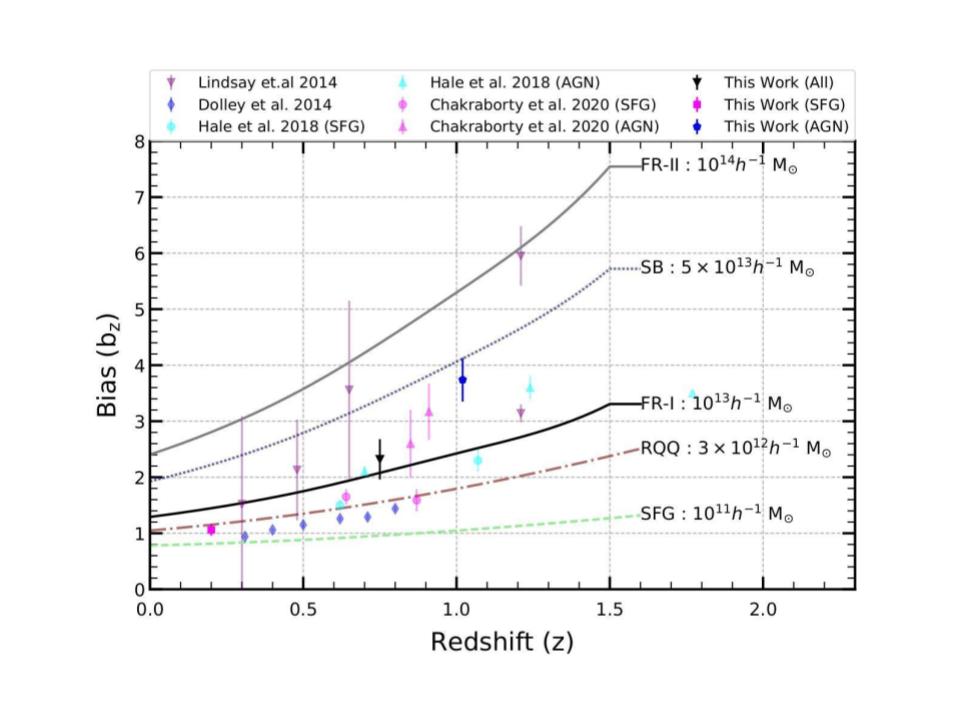
Figure 2: Bias parameter for the whole population (black inverted triangle) as well AGNs (blue pentagons) and SFGs (magenta squares). Bias parameters from previous observations are shown by the colored symbols. Predictions from simulations are also shown by the continuous curves. Note that the mass predictions are for different populations of radio-selected galaxies. (Image credits)
In Figure 2, the different coloured symbols show the bias parameters from our own data, as well as studies done previously. The different lines come from a simulation that calculated how masses of different galaxy populations evolve as a function of redshift. We see that our population of AGNs (deep blue pentagon) is dominated by FR-I type galaxies at a redshift of about 1 (readers are encouraged to visit here for an introduction to different types of AGNs), with typical host haloes of mass of about 3 x 10¹³ times the mass of the sun. This is in general agreement with other observations and implies that the dominant population of AGNs is FR-I type galaxies. The bias parameter of our SFG sample (magenta square at redshift 0.2) shows something interesting. While the values are roughly in agreement with previous observational studies, comparison with simulations shows that the mass of SFGs hosts are underestimated in the simulations. They have a value of around 1012 times the mass of the sun, while simulations predict an order of magnitude lower mass (1011 times the mass of the sun). The disagreement points to either of two problems- our simulation models are not accurate enough and we need better modeling accuracy or our sample is contaminated with some high halo mass galaxy which was miscategorised. In this particular case, the former seems to be the problem, since the other observed data also point to a host halo mass being greater than the simulated model.
This shows the need for better modeling of the evolution of different radio source populations, informed by data. Models are only good so long as they explain our observations. If our data analysis is not obviously wrong, but still mismatches models, re-doing theoretical models is the way to go.
Original paper: A study on the clustering properties of radio-selected sources in the Lockman Hole region at 325 MHz
First Author: Aishrila Mazumder
Co-authors: Arnab Chakraborty, Abhirup Datta
First author’s Institution: Indian Institute of Technology Indore, India